Key numbers
Every count is a number of conversations, not a survey percentage: “30 of 35” means 30 of the 35 conversations raised the topic with specifics.
- 30 of 35built or trialled their own AI tooling for marketing work
- 26 of 35described limits to what they built
- 18 of 26teams that hit limits got wrong answers or answers that missed context
- 8 of 35staffed a build: paid engineers or data people for months to build their own tool
- 26 of 35want AI that diagnoses problems or drafts changes for a person to approve
- 4 of 35want AI that steers and learns on its own
- 16 of 35named a condition before a machine may act on their accounts
- 30 of 35distrust at least one data source they make budget decisions on
- 9 of 10Pipeline-led conversations raised getting answers from their own data without a data ticket
- 3 to 4 weeksfor one team to spot a partial tracking break in one country (a single team’s figure)
How to cite: Nupact, The State of AI in Performance Marketing 2026: Past the prototype. 35 interviews with marketing leaders, June to September 2026. nupact.ai/research/state-of-ai-performance-marketing. Please quote counts as “X of 35”, not as percentages.
Find where your team fits
Two axes explained most of the differences we heard: the business model shaped which problems hurt, and team capacity shaped what anyone could do about them. Industry mattered less than either. Each cell counts the conversations in it.
| Business model | Lean≤3 people in performance, no BI supportn=14 | Scale-updedicated team plus a data or BI teamn=13 | Enterprisecorporate governance, listed or regulated, or >€5M a monthn=8 |
|---|---|---|---|
| Pipeline-leda sale closes weeks later, often offline, n=10 | 4 | 5 | 1 |
| Creative-ledD2C, subscription, apps, gaming, n=15 | 7 | 5 | 3 |
| Search-leddemand capture, feeds, automated bidding, n=10 | 3 | 3 | 4 |
Freelancers and agencies sit in the row of their main client type. The full report has the jobs, examples and workarounds for each row.
Six findings
- 1How your business makes money decides what you struggle with, more than industry or job title. Pipeline-led teams struggle with measurement and offline data, Creative-led teams with producing enough creative, and Search-led teams with broken conversion signals and automated bidding.What to do: Compare yourself with teams that make money the way you do, whatever their industry.3 segmentsproblem rankings differ by segment
- 2Most teams have already tried building their own AI tools, mostly as DIY with general AI. A technically minded marketer connects Claude or ChatGPT to the ad accounts and data, on top of the day job. Reporting got faster first.What to do: If reporting still eats your Mondays, DIY with general AI is the cheapest win left.30 of 35built or trialled AI tooling
- 3Self-built AI tools break down in the same five places. Wrong answers or missing context, no access to the data, far more effort than planned, nobody to maintain them, and too few people with the skills.What to do: Before building more, budget for data access and for someone to check the answers.26 of 35described limits
- 4When the tools hit their limits, teams take one of three routes. Eight of the 35 pay engineers or data people for months to staff a build of their own. Others buy software, while the rest stay with DIY with general AI.What to do: If you staff a build, price it in people and months before you start.8 of 35staffed a build
- 5Most teams want AI that finds problems and drafts the fix. Only four want it to act alone. Teams willing to let a machine act name the same conditions: every change logged and previewed, and an alarm when something fails.What to do: Put a change log and a rollback in place before any automation acts on its own.26 of 35want diagnosis or approved changes; 4 want full autonomy
- 6Almost everyone budgets on numbers they only partly trust, and that started long before AI. Most only admitted it when we asked.What to do: Fix conversion tracking and data feeds first. Automation running on a broken signal spends money faster in the wrong place.30 of 35distrust at least one source
Who we spoke to
| When | 35 conversations of about an hour each, June to September 2026. They were part of about a hundred conversations Federico Baravalle had with marketing leaders this year. |
| Who they are | Heads of performance, growth and digital; channel owners and senior specialists; CMOs and marketing directors; agency founders and freelancers. |
| Where they work | Mostly DACH, the Nordics, Italy, the UK and the US, with single conversations covering Brazil and India. |
| How we found them | From Federico’s network and direct outreach. None were Nupact customers. |
| How the counts work | We logged 610 individual jobs, pains and workarounds and merged them into 82 distinct jobs. Every count on this page is a number of conversations, except the Creative-led column of the heat map, which is scaled from 15 to 10. Names and companies stay anonymous. |
How the business makes money shapes which problems hurt
These are the jobs teams ask AI to do, and most of them were problems long before AI arrived. Each number is how many conversations in the segment raised the job with specifics.
| Job | Pipeline-led | Creative-led (scaled) | Search-led |
|---|---|---|---|
| Prove which channels actually drive revenue | 7 | 5 | 7 |
| Answer an ad-hoc question without a data ticket | 9 | 3 | 4 |
| Check performance daily or weekly | 8 | 3 | 5 |
| Get alerts where the team already works | 6 | 2 | 7 |
| Build, upload and name campaigns and ads | 5 | 7 | 4 |
| Learn which element of a winning creative works | 2 | 6 | 1 |
| Produce enough creative variants | 3 | 5 | 3 |
| Protect the conversion signals bidding runs on | 4 | 1 | 5 |
| Kill the recurring report deck | 6 | 4 | 2 |
Pipeline-led and Search-led had 10 conversations each; Creative-led had 15, scaled to 10 to make the columns comparable. Download this chart (PNG)
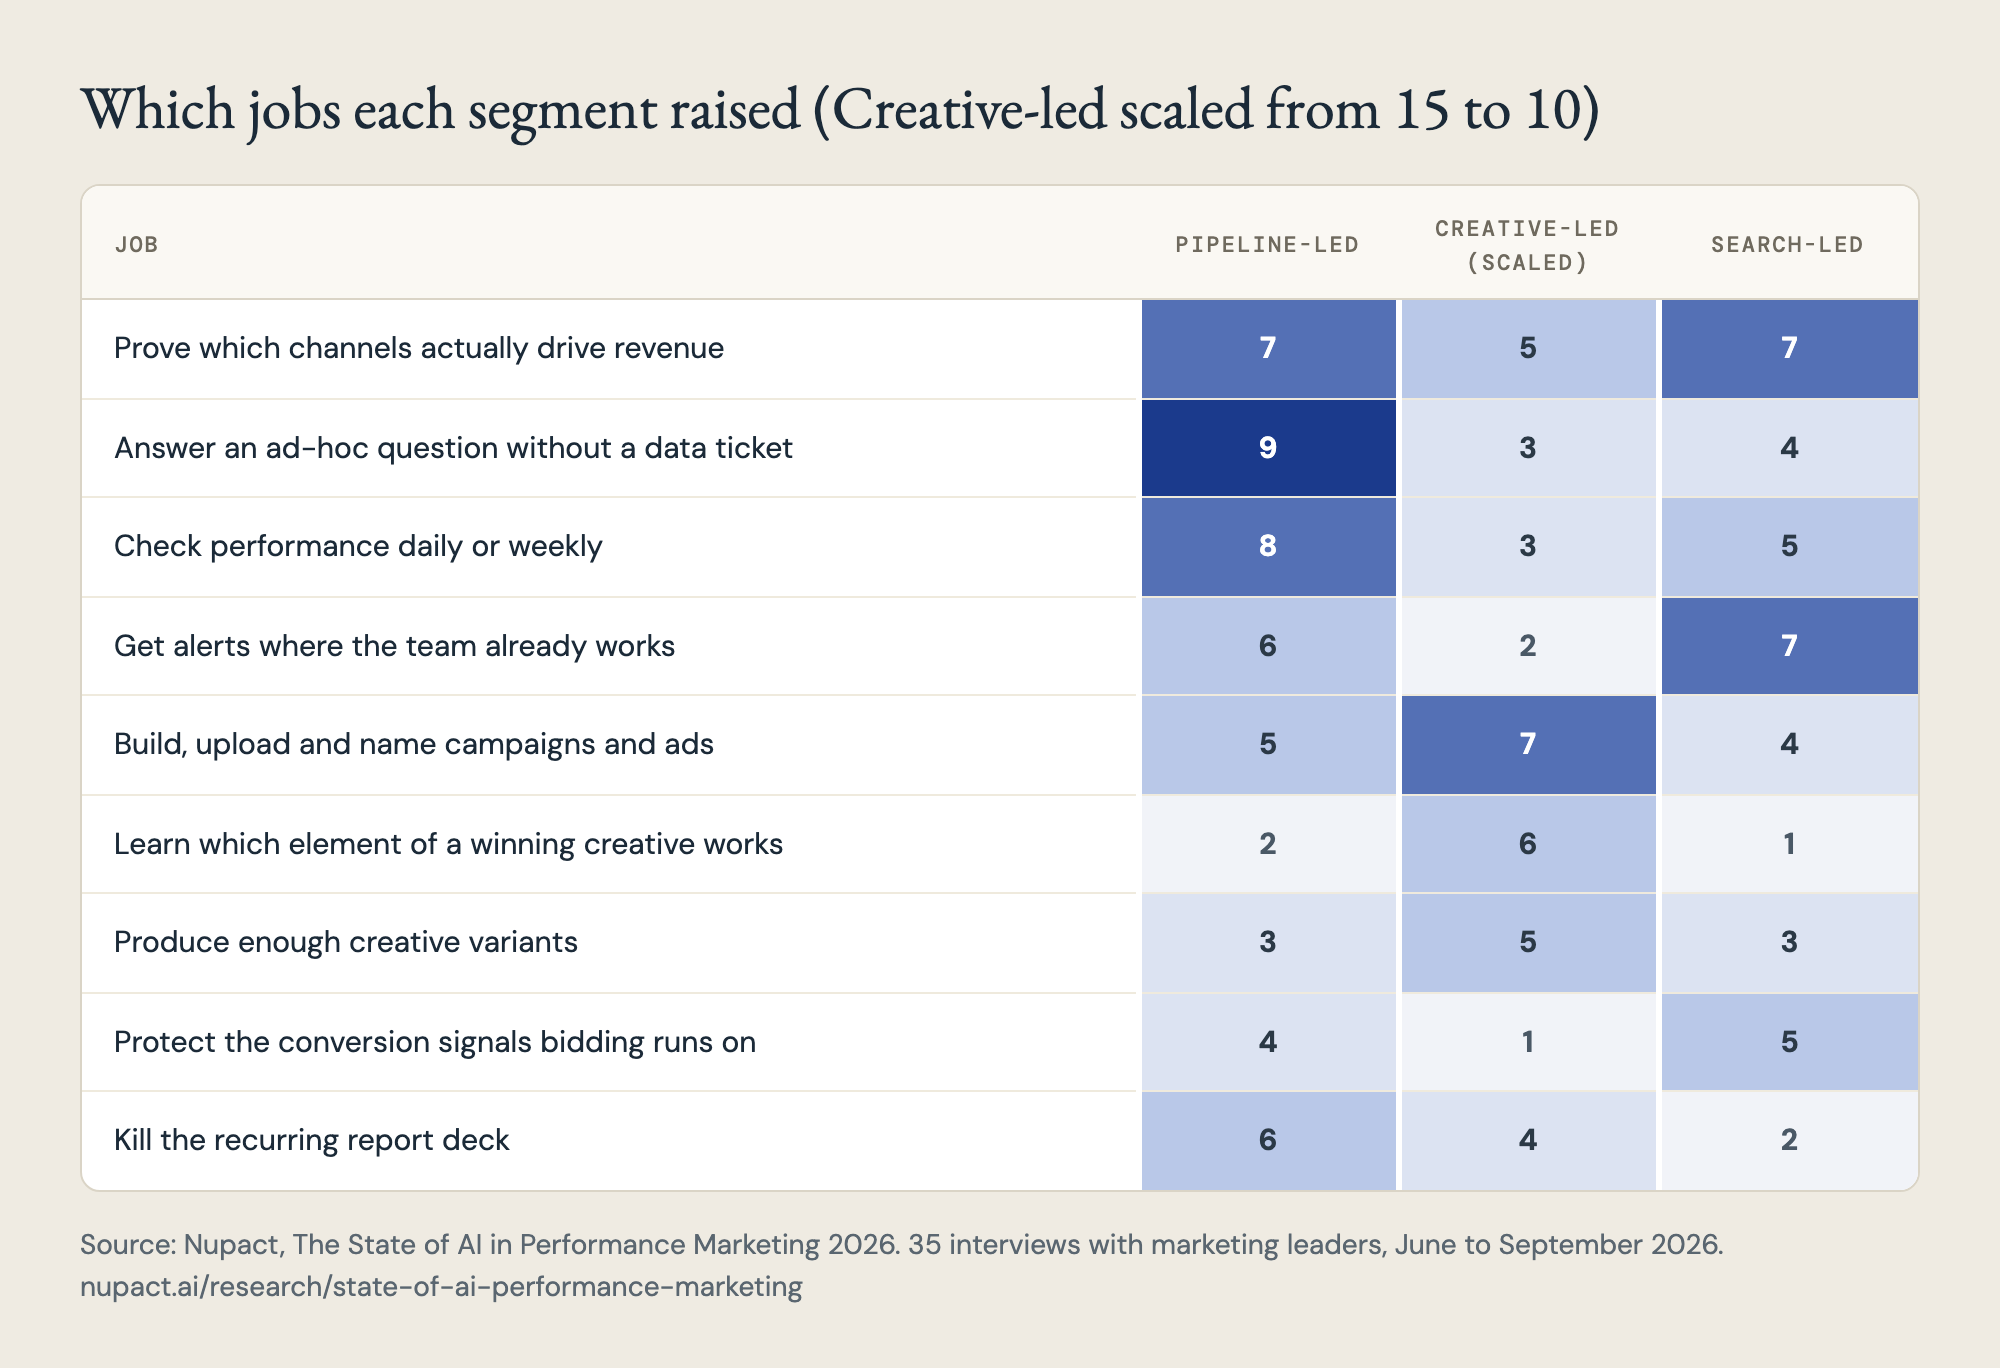
- Every segment struggles with incrementality. It runs high in all three, so it tells you little about which one you are in.
- Pipeline-led teams wait for their own data. 9 of 10 raised getting answers without a data ticket, and 8 of 10 the daily check.
- Creative problems cluster in Creative-led teams. Upload grind, creative analytics and creative volume rank higher here than in the other two segments.
- Search-led teams watch alerts and conversion signals. Execution was a pain in only 4 of these 10: bidding and feeds already automate it. What hurts is a broken signal, because the bidding keeps spending on it until someone notices.
Three problems every segment shares
| Measurement nobody fully trusts | Nearly everyone distrusts at least one number they budget on. A home-goods brand deleted its internal reporting because it diverged from the platforms; a fintech app paid an incrementality vendor whose numbers the team kept questioning. |
| Checking to defend decisions upward | More than half of the teams check performance partly for this reason. One person opens the dashboard “because I know she will ask”, and screenshots it before big decisions because the numbers change later. |
| Problems that run for months unnoticed | A campaign ran about a year at three times normal cost per click; the team explained it with lower inventory. A missing button cut a funnel by 20% for months. |
Reporting is where AI saves time first
30 of 35 built or trialled AI tooling. Reporting tools saved the most hours, and their errors can look right until someone checks. Meta execution at volume and measurement have not got faster anywhere.
| What they built | Stack | Status and result |
|---|---|---|
| Monthly report generated from the warehouse | General AI + warehouse MCP | Unreliable: “plain wrong in some places” |
| Scheduled reporting, plus live changes from the command line | General AI, CLI, cron | Decaying: CLI disconnected, report never on time |
| Search-term application staging bulk changes | AWS; LLM tested on a sample | LLM blocked: 80 to 85% accuracy, too costly at millions of terms a day |
| AI insights across joined backend and channel data | General AI, MCP (pending) | Blocked: waiting on privacy approval |
The full report lists all 15 tools teams told us about, from scheduled reports to the only tool trusted to move budget on its own.
The most common complaint is that the AI gets it wrong
26 of 35 described limits to what they built. The same five walls came up, here from most to least often; one conversation can show several.
| Wall | Conversations, of 26 | What it looks like |
|---|---|---|
| Accuracy and missing context | Silent SQL errors that look right. Hypotheses stated as facts. Analyses that miss a landing-page test nobody told the model about. Accuracy that sounds good and is still too low to deploy. | |
| Data access | Sources without APIs, warehouses behind approval chains, an AI assistant with no access to marketing data. | |
| Effort larger than planned | Hundreds of business rules and corner cases. Data teams who know the warehouse but not marketing. Dashboards that cost more to set up than the manual work they replace. | |
| Maintenance and the one-person risk | Scheduled jobs decay when the builder gets busy. Tracking knowledge lives in one head. An automated daily report that never runs on schedule. | |
| Skills and adoption | DIY with general AI works for the one enthusiast and frustrates everyone else. Leadership over-estimates what a team with general AI tools can deliver. |
Checking the AI’s answers is a job nobody owns
Most AI output still needs a person to check it, and no team we spoke to had tooling, a budget line or an owner for that check. Where DIY with general AI works, the builder usually checks every output. Nobody pays for that checking or logs it, and it stops when the builder leaves.
General AI tools are enough when the job is narrow and someone technical owns it
A few teams told us general AI tools cover what they need. The walls appear as soon as either condition no longer holds: the job spreads across accounts and people, or its owner moves on.
How the teams prevent each wall is in the full report.
Most teams want AI that diagnoses problems and drafts the fix
We asked each person for the most they want from AI. 26 of 35 named an explanation of why something moved, or a drafted change they approve. Only 4 want a system that steers on its own.
| Capability | Conversations, of 33 | What it takes to run, beyond the model |
|---|---|---|
| Rule-based alerts, automated reports | API access, thresholds you can defend. Static thresholds are arbitrary: an alert set at 20% stays silent at 19%. | |
| Answers questions on your data | Written KPI definitions and query-ready tables. Without them, confident answers rest on a wrong join nobody inspects. | |
| DIY with general AI stops working here | ||
| Explains why it moved; recommends | Cross-source data, the change log, seasonality, business rules, and someone who verifies. Accuracy is the wall here. | |
| Drafts changes, a human approves | Write access, previews, rollback, acceptance tracking, and someone to review every draft. | |
| Steers and learns on its own | Everything above, plus a trusted model that learns from outcomes. | |
The highest level each person wanted; two conversations gave no basis. Download this chart (PNG)
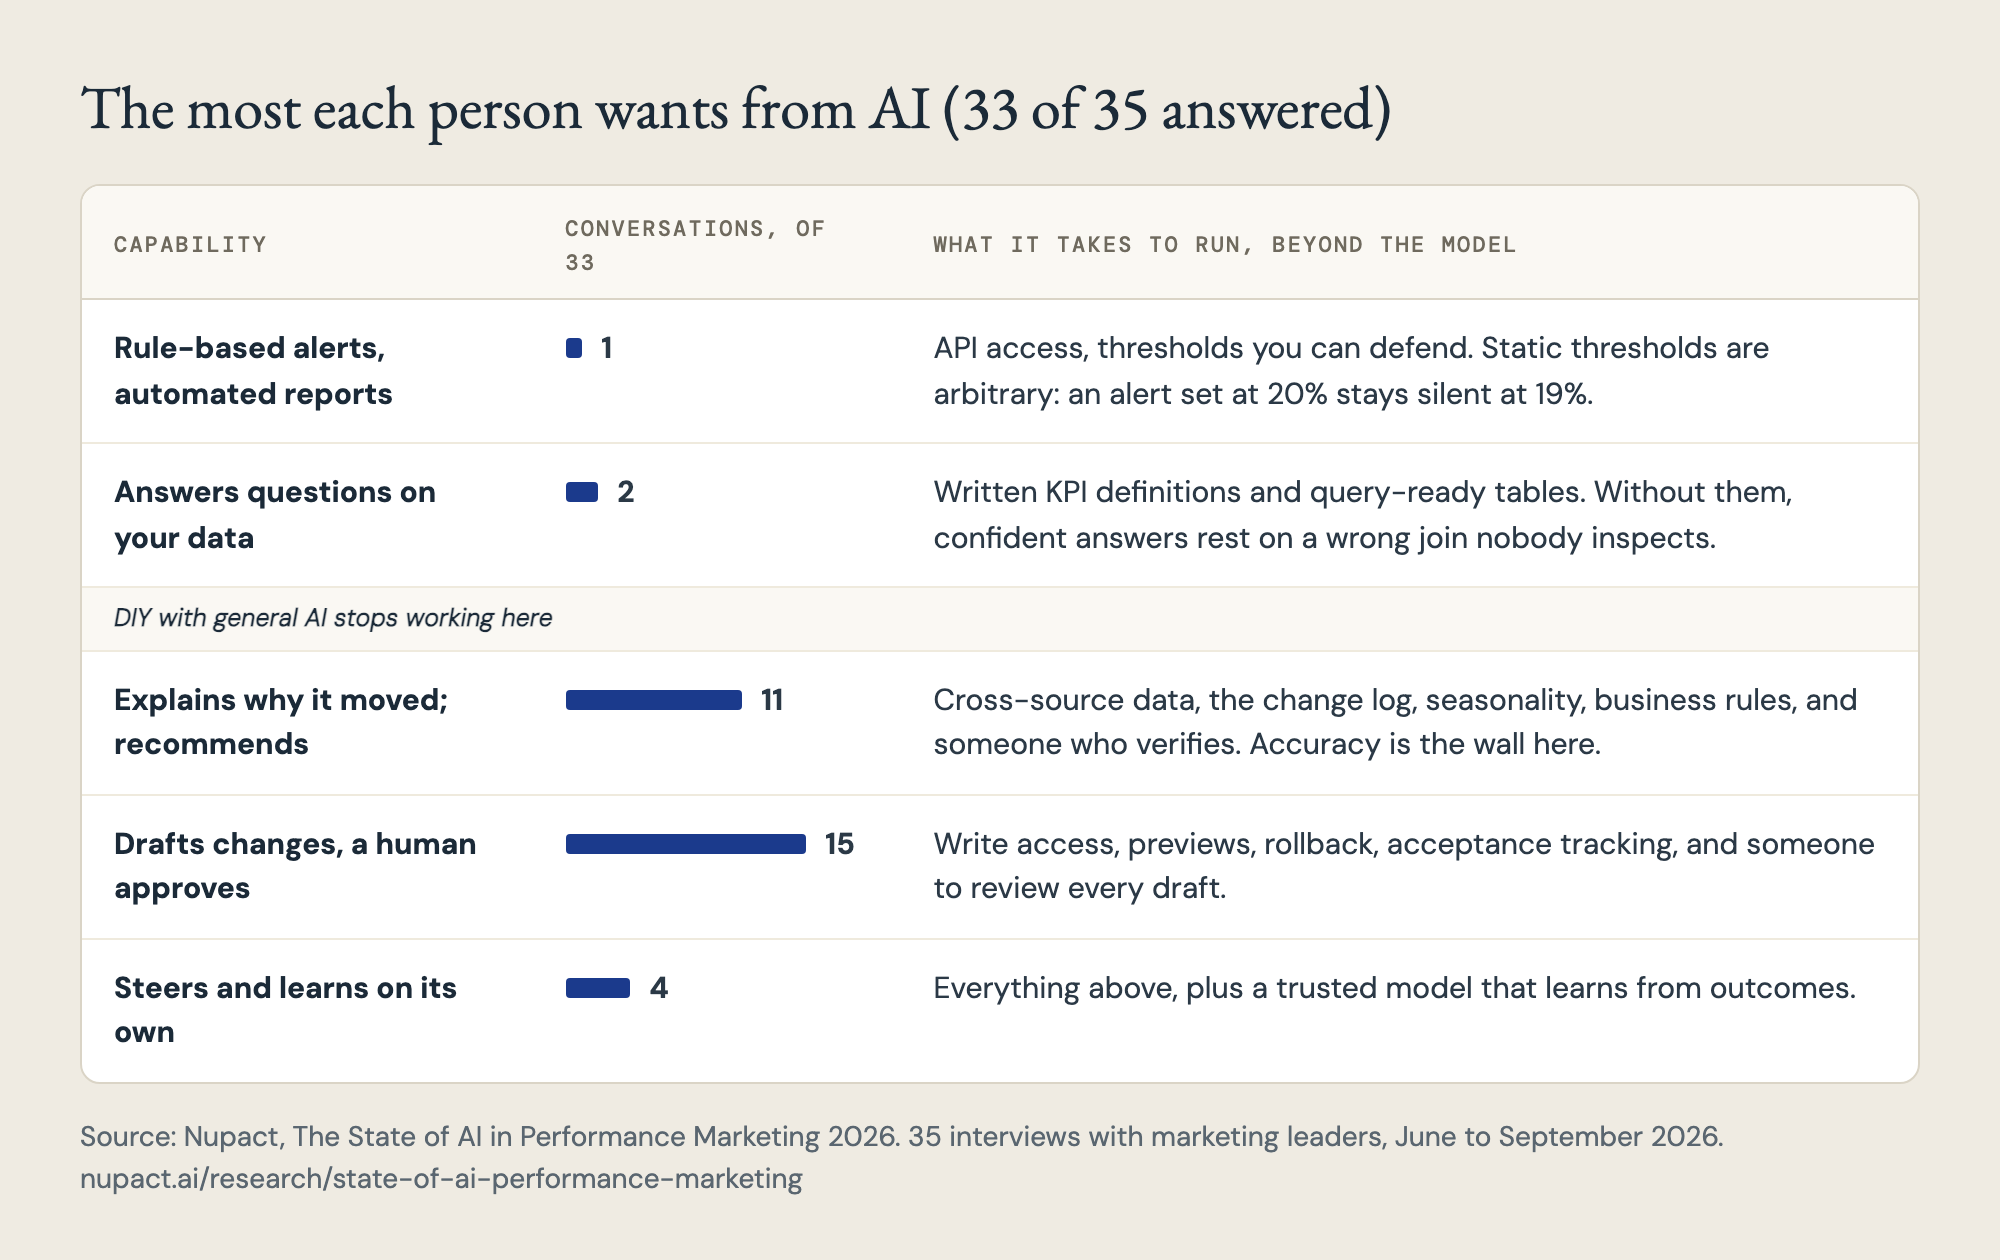
The conditions people set before a machine may act, at least one named in 16 of 35 conversations: every change logged, an alert before big changes, a preview of the expected effect, an alarm on failure, and small scope first, expanded gradually. A head of marketing who dropped two bidding tools after silent half-executed changes has one condition for any successor: “it doesn’t break without me knowing it.”
Which route fits each level and team size (staff a build, buy or DIY with general AI) is in the full report, with a map of where the 35 teams sit.
Teams often find problems in their accounts days or weeks late
Each figure comes from one team, as they reported it to us. Use them to see where you stand; they are not averages. These are 12 of the 33 data points in the full report.
| What happened | How long |
|---|---|
| Detection lag | |
| Best case: in-house signal monitoring, travel platform | <1 day |
| Landing-page rebuild killed lead tracking | 4 to 5 days |
| Meta cost cap stopped spend, education provider | found after 4 to 5 days |
| CTV CPM up 50% | ~10 days |
| Competitor bid raise, ~half impression share lost | >1 week |
| Partial tracking break in one country | 3 to 4 weeks |
| Missing call-to-action, −20% funnel entry | months |
| Misconfigured campaign at 3x CPC | ~1 year |
| Google recovery after a conversion incident | 10 days to 2 weeks |
| Work and approvals | |
| Creatives uploaded, one-person D2C team | ~120 a week, ~10 min each |
| Priority-one analysis from the data team | 4 months |
| Onboarding a compliant tool | 6 months |
“If something breaks on a Thursday afternoon, Google picks it up on a Sunday.”
The playbooks are in the PDF.
- The problems, examples and workarounds for each segment
- Team size and governance: why culture decides whether AI reaches your data
- All 15 AI tools teams built, with their status
- The three routes: staff a build, buy, or DIY with general AI
- Which route fits your team, by level and team size
- All 33 data points from individual teams
- What the front-runners already do, by segment
- Nine questions for your next planning meeting
Rather talk it through? Compare notes on build vs buy with Federico, 30 minutes.